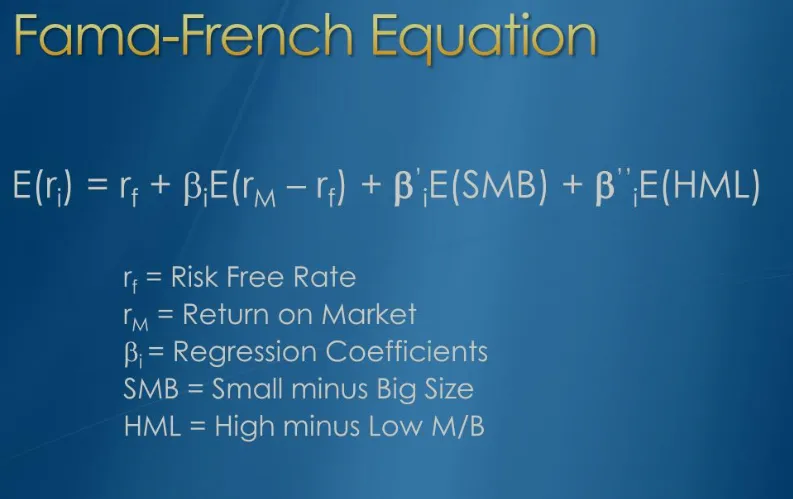
Today, I want to walk you through estimating the Fama-French Three and Five-Factor Models. Let’s dive right in!
Fama-French Three-Factor Model:
E(Ri) — Rf = α + β1(Rm — Rf) + β2(SMB) + β3(HML) + ε
Where
- E(Ri) is the expected return of stock i
- Rf is the risk-free rate
- α is the stock-specific intercept
- β1, β2, and β3 are factor loadings
- Rm is the expected return on the market portfolio
- Rm — Rf is the market risk premium
- SMB (Small Minus Big) is the size factor, representing the excess return of small-cap stocks over large-cap stocks
- HML (High Minus Low) is the value factor, representing the excess return of value stocks (high book-to-market ratios) over growth stocks (low book-to-market ratios)
- ε is the residual (error term)
Fama-French Five Factor Model:
E(Ri) — Rf = α + β1(Rm — Rf) + β2(SMB) + β3(HML) + β4(RMW) + β5(CMA) + ε
Where:
- E(Ri), Rf, α, β1, β2, and β3, Rm — Rf, SMB, and HML are as described above in the Three Factor Model
- β4 and β5 are additional factor loadings
- RMW (Robust Minus Weak) is the profitability factor, capturing the excess return of high-profitability firms over low-profitability firms
- CMA (Conservative Minus Aggressive) is the investment factor, representing the excess return of firms with conservative investment strategies over firms with aggressive investment strategies
- ε is the residual (error term)
These equations represent the Fama-French models, which are used to analyze the sources of a stock’s return and to understand how different factors contribute to its performance.
Step 1: Data Collection
To estimate the Fama-French models, you will need the following data:
- Stock returns: You will need the historical stock returns of the companies you want to analyze. These can be obtained from sources like CRSP or Yahoo Finance.
- Risk-free rate: This is typically the return on a short-term government bond, like a 3-month US Treasury bill.
- Fama-French factors: The SMB, HML, RMW, and CMA factors can be downloaded from Kenneth French’s Data Library.
Step 2: Data Preparation
Before estimating the models, you will need to perform some data preparation steps:
- Calculate excess returns for each stock by subtracting the risk-free rate from the stock returns.
- Merge the excess return data with the Fama-French factors, ensuring the time periods match.
Step 3: Estimate the Fama-French Three-Factor Model
Using the prepared data, run a multiple regression with the excess return of each stock as the dependent variable and the market risk premium (Rm — Rf), SMB, and HML factors as the independent variables. The equation should look like this:
Excess Return = α + β1(Market Risk Premium) + β2(SMB) + β3(HML) + ε
Step 4: Estimate the Fama-French Five Factor Model
Similar to Step 3, run a multiple regression with the excess return of each stock as the dependent variable, but this time include the RMW and CMA factors as well. The equation should be:
Excess Return = α + β1(Market Risk Premium) + β2(SMB) + β3(HML) + β4(RMW) + β5(CMA) + ε
Step 5: Interpret the Results
After estimating the models, analyze the coefficients (β1 to β5) to understand the sensitivities of each stock to the various factors:
- A positive β1 indicates that the stock’s return is positively correlated with the market risk premium.
- A positive β2 suggests that the stock tends to perform well when small-cap stocks outperform large-cap stocks.
- A positive β3 implies that the stock has value characteristics and is likely to perform well when value stocks outperform growth stocks.
- For the Five Factor Model, a positive β4 indicates the stock has high profitability, while a positive β5 suggests that the stock follows a conservative investment strategy.
Here’s an example of how to estimate the Fama-French Three and Five-Factor Models in R using the lm() function for linear regression.
- Install and load required packages:
install.packages("tidyverse")
install.packages("quantmod")
install.packages("readxl")

library(tidyverse)
library(quantmod)
library(readxl)
2. Load the stock returns, risk-free rate, and Fama-French factors:
# Load stock returns (assuming you have a CSV file with Date, Ticker, and Return columns)
stock_returns <- read_csv("stock_returns.csv")

# Load risk-free rate (assuming you have an Excel file with Date and Risk_free_rate columns)
risk_free_rate <- read_excel("risk_free_rate.xlsx")

# Download Fama-French factors from Kenneth French's Data Library
ff_factors <- fread("https://mba.tuck.dartmouth.edu/pages/faculty/ken.french/ftp/F-F_Research_Data_5_Factors_2x3_CSV.zip") %>%
  mutate(Date = ymd(paste0(Year, "-", Month, "-01"))) %>%
  select(-c(Year, Month))
3. Prepare the data
# Calculate excess returns
excess_returns <- stock_returns %>%
  left_join(risk_free_rate, by = "Date") %>%
  mutate(Excess_Return = Return - Risk_free_rate)

# Merge excess returns with Fama-French factors
data <- excess_returns %>%
  left_join(ff_factors, by = "Date") %>%
  mutate(Mkt_RF = Mkt_RF / 100, SMB = SMB / 100, HML = HML / 100, RMW = RMW / 100, CMA = CMA / 100, RF = RF / 100)
4. Estimate the Fama-French Three-Factor Model:
three_factor_model <- lm(Excess_Return ~ Mkt_RF + SMB + HML, data = data)
summary(three_factor_model)
5. Estimate the Fama-French Five Factor Model:
five_factor_model <- lm(Excess_Return ~ Mkt_RF + SMB + HML + RMW + CMA, data = data)
summary(five_factor_model)
This example demonstrates how to estimate the Fama-French models in R using linear regression. Make sure to adjust the code to match your specific data sources and formats. The summary() function will provide the estimated coefficients and other relevant statistics for each model.
If you enjoyed this post and would like to stay updated on my latest insights, please follow me for more thought-provoking content on finance and investment strategies!
